Perspectives
Why Decibels Add While Power Ratios Multiply
A negative signal level is not negative power, and two power readings cannot usually be added as decibels. Worked examples follow a signal chain and expose the references hidden behind familiar dB labels.
A receiver reports minus eighty. Another reading says minus seventy. An amplifier promises twenty decibels, while a cable loses two. These numbers appear together so often that they can start to look like ordinary quantities on one common scale. But one may describe an absolute power level relative to a defined reference, another a ratio between two powers, and another a voltage ratio. Adding them without identifying those roles can produce a tidy calculation with no physical meaning.
Decibels are useful precisely because they simplify certain relationships. Multiplicative gains and losses become additions and subtractions. Large ranges fit into manageable numbers. The convenience is real, but it depends on carrying the reference and measured quantity along with the number. I want to investigate that dependency through a signal chain we can calculate in both ordinary power units and decibels. When the two versions agree, the shorthand earns our confidence.
All component values and measurements in this article are constructed. They are not specifications for a particular amplifier, receiver, or cable. The references establish the definitions and measurement conventions; the examples show their consequences. We will distinguish a ratio from a referenced level, power from voltage, and a cascade of gains from a sum of independent contributions. These distinctions explain most of the apparent contradictions that make decibel arithmetic feel mysterious.
A decibel starts with a comparison
For two positive powers, the level difference in decibels is ten times the base-ten logarithm of their ratio. NIST's guide presents the logarithmic power and field-quantity level definitions and emphasizes stating the reference.[1] If the second power is ten times the first, the difference is ten decibels. If it is one hundred times the first, the difference is twenty. The logarithm reports how many factors of ten separate the quantities, scaled by ten.
An increase of ten decibels therefore means multiplication of power by ten, regardless of the starting value. One milliwatt becoming ten milliwatts and one watt becoming ten watts have the same power ratio. They have very different absolute powers. Saying only “ten decibels” cannot tell us which pair was involved. The statement becomes meaningful when we identify the two quantities being compared or provide a defined reference for one of them.
For a power ratio of two, ten times the logarithm gives approximately 3.0103 decibels. The familiar three-decibel doubling rule is a convenient approximation. A ratio of one half gives approximately minus 3.0103 decibels. The sign tells us which side of the reference the measured power lies on. It does not mean the physical power has become negative. A smaller positive numerator produces a negative logarithm because the ratio is between zero and one.
Zero decibels means the compared quantities are equal. It does not mean no signal. If the reference is one milliwatt, a matching one milliwatt gives zero decibels relative to that reference. A truly zero positive-power limit would drive the logarithmic level toward negative infinity. A real instrument usually reaches its measurement limit long before that mathematical limit becomes the relevant description. Its lowest displayed number should therefore be interpreted with the instrument's stated behavior.
The small letter after dB matters
The notation dBm identifies a power level relative to one milliwatt. Analog Devices' conversion guidance distinguishes this from voltage references such as dBV, referenced to one volt, and dBu, referenced to 0.775 volts.[2] The suffix is part of the measurement, not optional typography. A value in dBm can be converted to a power without knowing another measured power. A gain in dB describes a ratio and needs an input level before it determines an output level.
In our examples, zero dBm is one milliwatt, ten dBm is ten milliwatts, and twenty dBm is one hundred milliwatts. Thirty dBm is one watt. Moving down the same scale, minus thirty dBm is one microwatt and minus sixty dBm is one nanowatt. These are not different types of electricity. They are the same positive power quantities written relative to a fixed reference through the logarithmic transformation.
Now compare minus seventy dBm with minus eighty dBm. The first is ten decibels higher and represents ten times the power of the second. The negative signs can make the ordering feel counterintuitive, but ordinary number order still applies: minus seventy is greater than minus eighty. What changes is the relationship between a difference on the displayed scale and a ratio in physical power. A ten-unit increase on this level scale multiplies power rather than adding ten watts or ten milliwatts.
The same reasoning gives a useful check on an incident report. “Signal improved by ten dBm” often intends to describe a ten-decibel increase between two readings expressed in dBm. More precise wording says the level rose from one stated dBm value to another, a difference of ten dB. This preserves the distinction between the referenced endpoints and their ratio. It helps prevent the next person from treating a gain figure as an absolute output power.
Follow one signal through three components
Start our fictional chain with ten dBm, which is ten milliwatts. The first component has a two-decibel insertion loss. The next supplies twenty decibels of power gain. The last has a three-decibel loss. Assume the specified gains apply at the operating frequency and power, the interfaces behave as modeled, and the amplifier remains in its linear range. The output level is 10 − 2 + 20 − 3, or 25 dBm.
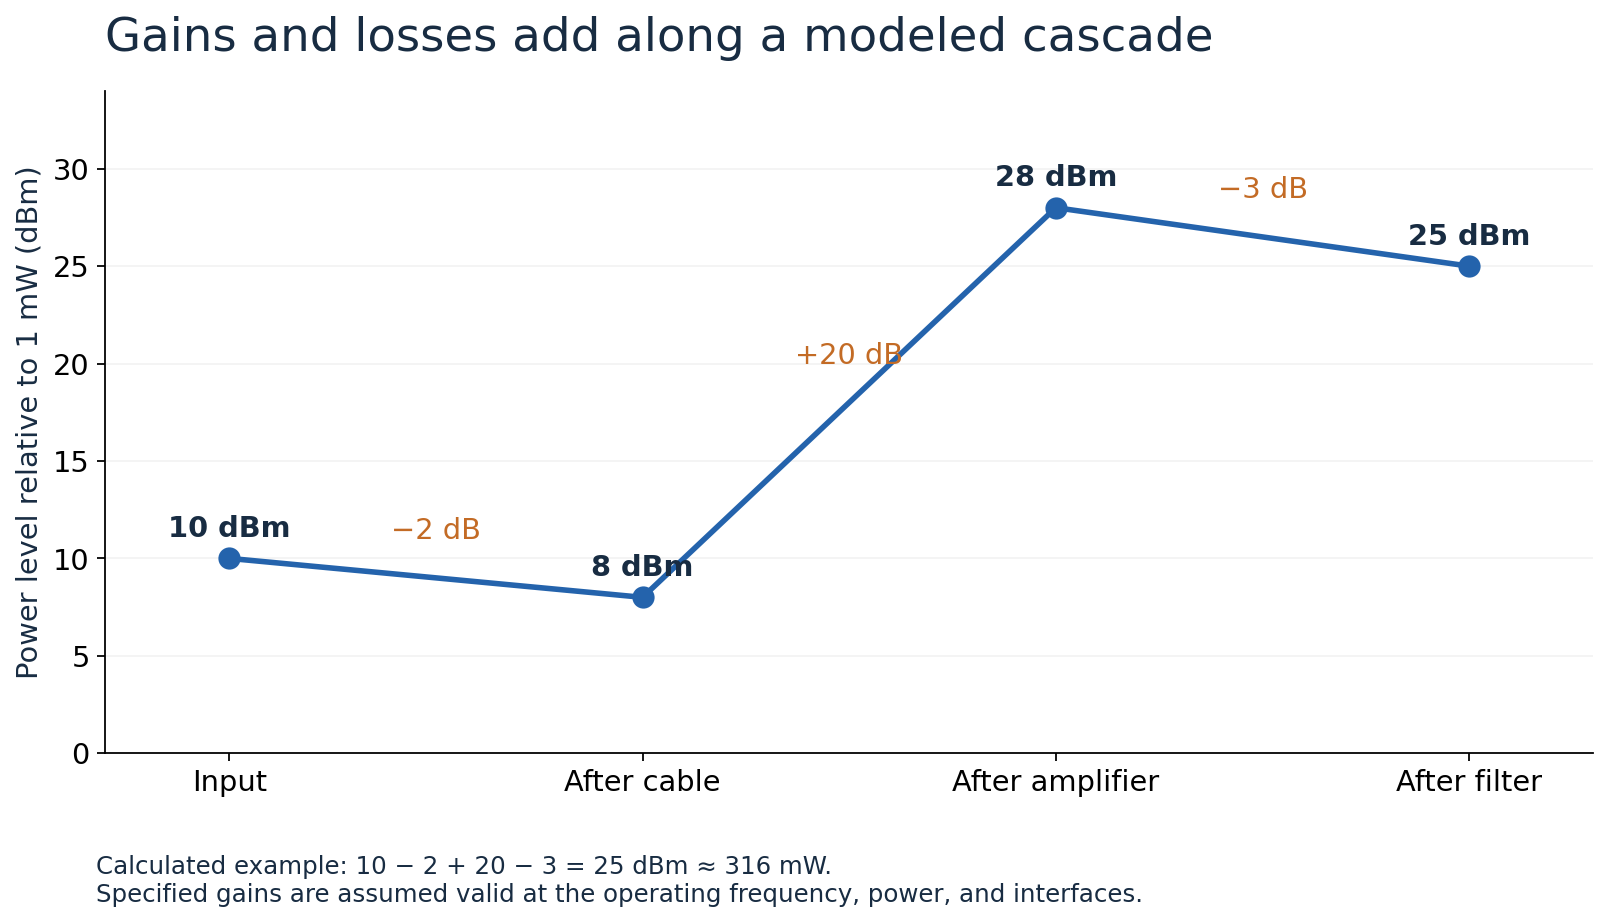
Figure 1. A calculated cascade under fixed linear operating conditions. Vertical values are referenced power levels in dBm; labels between stages are gains or losses in dB. These are not measurements or equipment recommendations.
Check the same chain in ordinary units. A two-decibel loss multiplies power by 10 to the power of minus 0.2, approximately 0.631. Ten milliwatts becomes about 6.31 milliwatts. Twenty decibels of power gain multiplies by one hundred, producing about 631 milliwatts. A three-decibel loss multiplies by approximately 0.501, leaving about 316 milliwatts. Converting 316 milliwatts back to dBm gives approximately 25. The two routes describe the same calculation.
The reason additions worked is the logarithm identity: the logarithm of a product equals the sum of the logarithms. Our three power ratios multiplied in the linear calculation. Their decibel values therefore added in the level calculation. Nothing about this identity allows arbitrary measured powers to be added as their dBm numbers. A cascade of ratios and a collection of simultaneous power contributions are different mathematical operations. The shortcut belongs to the operation that actually occurred.
The assumptions in the chain also matter. If the amplifier cannot deliver the calculated output under the actual conditions, its nominal small-signal gain does not justify the result. The arithmetic can be correct while the chosen component model is inappropriate. I would compare the predicted intermediate levels with the operating limits and available measurements. A budget is a model to test, not a guarantee that a physical system follows every number printed in the calculation.
Why voltage ratios use twenty in a common case
For a voltage across a resistance, average power is RMS voltage squared divided by resistance. If two measurements use equal resistance, their power ratio equals the square of their RMS voltage ratio. Putting that square inside ten times the logarithm brings the exponent outside, producing twenty times the logarithm of the voltage ratio. Keysight's conversion reference distinguishes these voltage and power relationships and makes its measurement references explicit.[3]
Doubling RMS voltage across the same resistance therefore quadruples power. The voltage ratio expressed with twenty times the logarithm is approximately 6.0206 decibels. The power ratio expressed with ten times the logarithm is also approximately 6.0206 decibels. The two formulas agree because the underlying quantities are related by a square. Choosing ten or twenty is not a matter of which answer looks familiar. It follows from what ratio is being expressed.
Now change the resistance and the simple correspondence needs another term. Apply one volt RMS across fifty ohms: the power is 0.02 watts, or twenty milliwatts. Apply the same voltage across one hundred ohms: the power is ten milliwatts. The voltage ratio is one, so its voltage-level difference is zero decibels. The power ratio is one half, so the power-level difference is about minus 3.01 decibels. There is no contradiction; the resistance changed the relationship between voltage and power.
This is why I would question an unexplained conversion from a measured voltage to dBm. The conversion needs the relevant impedance or an appropriate circuit model, and it needs a defined voltage measure. RMS, peak, and peak-to-peak values are not interchangeable. Analog Devices' discussion of RF power measurement examines conversions among these quantities.[4] A number copied from one display into a formula for another quantity can introduce a fixed error while leaving the result superficially plausible.
For a sinusoid, a peak amplitude of one volt corresponds to approximately 0.707 volts RMS. Across fifty ohms, that gives ten milliwatts, or ten dBm. Mistakenly treating the one-volt peak value as one volt RMS produces twenty milliwatts, approximately thirteen dBm. The three-decibel discrepancy comes from the definition of the voltage value, not an unexplained loss in a cable. A waveform with a different shape requires its own relationship between peak and RMS.
Adding powers requires going back to powers
Suppose two independent, uncorrelated contributions each deliver one milliwatt to the same accounting point, and their average powers add under the stated conditions. Each contribution is zero dBm. Their combined average power is two milliwatts, approximately 3.01 dBm. Adding the displayed levels as zero plus zero would give zero dBm and miss half the total power. The proper operation is to convert to linear power, add, then convert the total back to the logarithmic scale.
The independence qualification matters. If two coherent same-frequency waveforms combine at a receiver, their relative phase can affect the resulting power through a cross term. We examined that mechanism in the article on multiple propagation paths. Simply adding the individual powers can then be inappropriate unless the relevant averaging or conditions remove that term. The first step is therefore physical: identify how the contributions combine. Only after that should we choose the logarithmic calculation.
For a power-addition example without that cross term, combine ten milliwatts with one milliwatt. The individual levels are ten dBm and zero dBm, while the total is eleven milliwatts, approximately 10.414 dBm. The weaker contribution increases the total by about 0.414 decibels. It has not vanished, but it also has not increased the total by ten decibels. The calculation explains why a much weaker independent contribution can make only a small change to an aggregate power reading.
If the two contributions are equal, doubling their summed power always adds approximately 3.01 decibels. Four equal independent contributions add approximately 6.02 decibels relative to one. Ten add ten decibels. These relationships follow from the same power-ratio definition. They are useful mental checks, provided “equal” refers to the relevant powers at the same boundary and the conditions justify adding those powers. A familiar rule without that boundary can be applied to the wrong physical scene.
Averaging logarithms changes the question
Imagine a meter records zero dBm for one interval and twenty dBm for an equally long second interval. The underlying powers are one and one hundred milliwatts. Their arithmetic mean is 50.5 milliwatts, which is approximately 17.03 dBm. Averaging the displayed numbers instead gives ten dBm, equivalent to ten milliwatts. Those two averages are substantially different because applying a logarithm and taking an arithmetic mean do not commute.
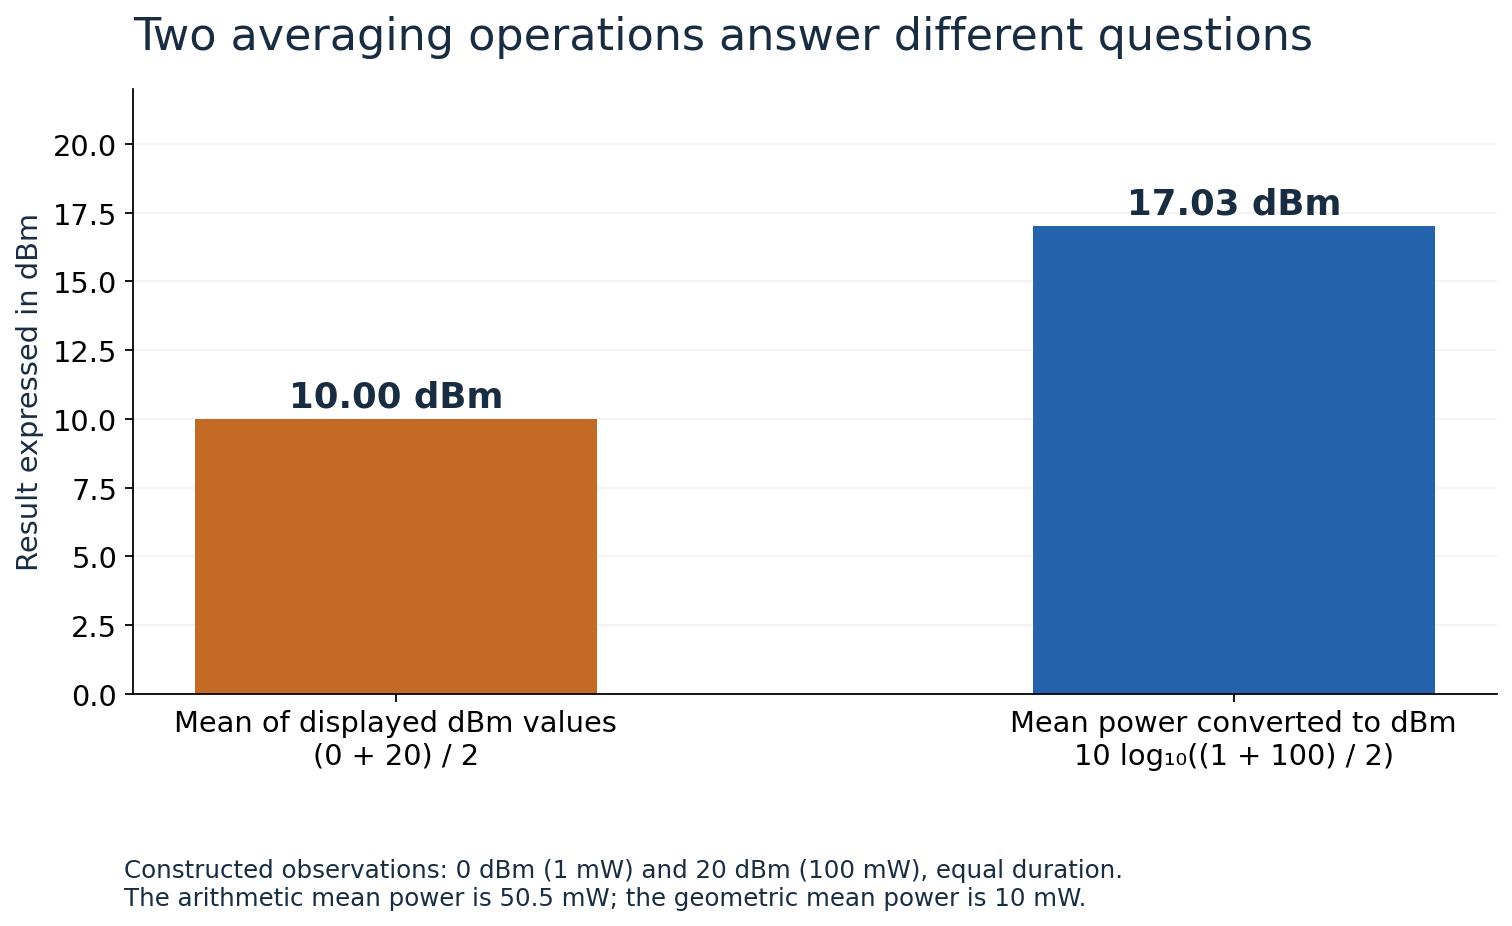
Figure 2. Constructed equal-duration observations. The mean of the dBm readings corresponds to a geometric mean of power; it is different from the arithmetic mean power. Neither column represents a new instrument measurement.
The average of the logarithmic levels corresponds to a geometric mean of the original positive powers. That may be a deliberate statistical quantity in a particular analysis. The mistake is reporting it as average power without saying what operation was performed. I would inspect the instrument or software's averaging definition before comparing results. Two tools can process the same samples differently and both display “average,” while answering different questions.
Unequal time intervals need weights as well. Suppose the one-milliwatt state lasts nine seconds and the one-hundred-milliwatt state lasts one second. The time-averaged power is (9 × 1 + 1 × 100)/10, or 10.9 milliwatts, approximately 10.37 dBm. A simple average of two logged states would ignore their durations. The event record must preserve enough timing information to calculate the average relevant to the intended claim.
Peak and average power provide another example. An idealized signal delivering one watt during ten percent of each cycle and zero otherwise has a time-average power of one tenth of a watt. The on-state power is thirty dBm; the average is twenty dBm. Both are correct for their definitions. An investigation comparing them should not describe the difference as an unexplained ten-decibel loss. It should first establish whether the two measurements refer to the same temporal quantity.
Signal-to-noise ratio needs a shared boundary
For a constructed receiver observation, suppose wanted-signal power is minus eighty dBm and noise power is minus ninety-five dBm over the same stated measurement bandwidth and boundary. Subtracting the levels gives a signal-to-noise ratio of fifteen decibels. In linear terms, the wanted power is about 31.6 times the noise power. The subtraction works because the two logarithmic levels share a reference, which cancels when taking their difference.
The bandwidth qualification is essential. A noise measurement integrated over one frequency range cannot simply stand in for noise integrated over a different range. To illustrate with a model, suppose noise power is uniform per unit bandwidth and the measurement bandwidth doubles. The integrated noise power doubles, increasing its level by approximately 3.01 decibels. If the wanted signal power remains unchanged and fully included, the calculated ratio falls by that amount. The change comes from the measurement definition in this example.
A signal-strength increase also does not automatically establish a ratio improvement. Imagine wanted power and noise power both rise by ten decibels. Their difference stays fifteen decibels. The larger signal reading looks encouraging in isolation, but the comparison has not improved. Real systems may involve additional interference and processing effects; the point of this example is narrower. The useful metric must include the quantities relevant to the decoding task, not merely whichever number is easiest to display.
Likewise, a fifteen-decibel ratio does not independently predict one universal data rate or error probability. Those outcomes depend on the modulation, coding, channel behavior, receiver, and the precise definition of the measured ratio. I would use it as a defined observation within an analysis rather than as a complete verdict. A number can be perfectly calculated and still insufficient to answer the broader question the user actually cares about.
References can move without the signal moving
Suppose the physical power stays at ten milliwatts. Relative to one milliwatt, its level is ten dBm. Relative to one watt, its level is minus twenty dBW. The numerical difference is thirty decibels because the references differ by a factor of one thousand. Nothing happened to the signal when we changed notation. A report combining levels from different references should convert them consistently before comparison, just as it would reconcile metres and kilometres.
Relative displays introduce a similar issue. If an analyzer defines its current trace as a zero-decibel reference, later values describe changes relative to that stored trace. Zero on that display does not mean zero dBm unless the reference happens to be one milliwatt and the quantity is power. I would preserve the reference-setting event or value in a measurement record. Otherwise a later screenshot may look self-contained while missing the quantity that gives every ordinate its meaning.
The sign of a voltage waveform should not be confused with a negative logarithmic level either. A sinusoid takes positive and negative instantaneous values around its reference. Its amplitude or RMS magnitude can still be positive and compared logarithmically. A negative voltage level in dBV describes a magnitude below the voltage reference, not a waveform that always lies below zero volts. Phase and polarity carry information that a magnitude-only level does not preserve.
An uncertainty interval needs the same care. A constructed ten-dBm reading with bounds of nine and eleven dBm corresponds to about 7.94 through 12.59 milliwatts around ten milliwatts. Symmetry on the logarithmic scale becomes asymmetry in linear power. The conversion preserves the interval; it does not establish what confidence, coverage, or specification those bounds represent.
Make the shorthand auditable
When a calculation looks suspicious, I would convert at least one step back to ordinary units. If a supposed three-decibel power increase produces a tenfold result, something is wrong. If two equal independent powers add without raising the total level, something is wrong. If a voltage-to-power conversion has no impedance assumption, the explanation is incomplete. These are useful checks because they connect the shorthand to the physical quantities it is intended to represent.
Rounding should remain visible too. Ten ideal stages that each double power produce a factor of 1,024, or about 30.103 decibels. Rounding every doubling to three decibels gives thirty decibels, equivalent to a factor of one thousand. That is often an acceptable approximation, but it is not exact. The discrepancy is about 2.34 percent relative to the actual factor. A calculation requiring tighter agreement should carry more precision and round at the reporting stage.
I would report the original units, reference, measurement boundary, bandwidth where relevant, and averaging method alongside an important level. For a cascade, I would state which gains and losses are power ratios and whether they apply under the assumed operating conditions. For a sum, I would explain why the contributions' powers can be added. These details make another person's independent calculation possible. They are more valuable than a long string of decimals attached to an undefined “dB” reading.
Decibels become straightforward once we keep the comparison visible. Gains add because their underlying ratios multiply. Referenced levels subtract to form ratios because their common reference cancels. Powers add through a different operation, and voltage needs its relationship to power stated before the two are interchanged. The notation is a compact account of those relationships. It is most useful when the reader can still recover the quantities, assumptions, and physical boundaries that the compact account represents.
References and method
- NIST, Guide to the SI, Chapter 8; logarithmic level definitions and reference quantities.
- Analog Devices, RMS, dBm, dBu, and dBV Conversion Guidance; power and voltage references.
- Keysight, Useful Formulas, Conversions, and Reference Information; analyzer voltage and power conventions.
- Analog Devices, Measurement and Control of RF Power, Part I; RF power measurement and voltage conversions.
All signal chains, readings, and component values are constructed. Figures show calculations rather than measurements. Power-addition examples explicitly assume conditions under which the relevant average powers add. Sources checked on 3 October 2026.