Perspectives
Signals Are Everywhere. Why Do We Notice So Few of Them?
A connected but silent phone call, six invented sensor readings, and an empty graph reveal the difference between a signal, a message, and the explanation we build around them.
You are reading this while other things happen around you. Light reaches your eyes. Someone might be speaking in another room. A router exchanges traffic with devices you are barely thinking about. Your phone may have just received a notification. We can gather these events under the word “signal,” but doing so creates a problem as well as an opportunity. It gives us a useful question: what change carries information about what event? It can also make very different mechanisms sound like one mysterious substance flowing through everything.
I want to keep the useful question and investigate the differences. This series starts with communication systems because they make those differences unusually visible. A call can connect while the people at either end hear nothing. A dashboard can display a healthy service while a user cannot complete a task. A sensor can produce a precise number that supports a poor decision. In each case, information exists somewhere. The difficulty is establishing what it tells us, where it came from, and how far we can reasonably extend its meaning.
Consider a deliberately hypothetical incident. You call someone. The screen begins counting the duration, but neither of you hears speech. It is tempting to say, “The network is broken.” That sentence is large enough to contain almost every component involved: the microphone, audio processing, packets, routing, the receiving application, and the speaker. It names an area of suspicion without identifying a cause. An investigation begins when we replace that broad explanation with smaller questions that observations could actually answer.
The interesting thing is that the connected indicator may be correct. It may accurately report a particular state of the session. The error happens when we treat that limited report as evidence that the entire conversation path works. A successful step is useful evidence, but its boundaries matter. This is where signals become more interesting than decorative waveforms. Understanding them means understanding the relationship between an observation and the claim built on top of it.
A signal is not the message's meaning
For this opening discussion, I will use a practical description: a signal is a measurable or distinguishable variation that we use to learn something about an event or state. That is a working description, not a universal definition for every discipline. Engineering often represents signals as quantities varying with time or position. MIT's Signals and Systems course develops both time-domain and frequency-domain representations.[1] Before choosing either view, however, there is a simpler question: what quantity are we examining, and with respect to what variable?
A message is not identical to its physical representation. “Close the door” can appear as marks on paper, pixels on a display, or spoken sound. The instruction survives changes of medium. Its interpretation also depends on context: it might be a request, an order, a quotation, or part of a joke. Recovering the pattern accurately and understanding its intention are different achievements. A receiver can reproduce symbols without understanding them, while a person can sometimes infer meaning from an imperfect reproduction.
Claude Shannon's 1948 paper makes a powerful move here. It separates the engineering problem of communication from the semantic meaning of messages and describes a system involving a source, transmitter, channel, receiver, and destination, with noise affecting transmission.[2] This does not establish that meaning is unimportant. It establishes a boundary around a particular problem. Once that boundary is explicit, we can ask precise questions about transmission without pretending we have also explained language, intention, or human understanding.
Imagine asking someone to transcribe a sentence in a language they do not speak. They might reproduce its sounds carefully and understand almost nothing. Now imagine giving a familiar speaker a damaged recording in their own language. Context might let them reconstruct much of its meaning. Which person performed better? The question is incomplete until we specify the task. Faithful reproduction, intelligibility, and interpretation require different evidence. The same distinction matters when we evaluate a voice interface or praise an impressive automatic transcript.
The two paths inside a phone call
Telephony gives us a concrete division of responsibilities. SIP is an application-layer control protocol for creating, modifying, and terminating sessions.[3] RTP provides transport functions suitable for real-time data such as audio and video; it does not itself guarantee quality of service.[4] In the hypothetical silent call, that distinction suggests a question rather than an answer: did the session exchange succeed while the media path failed? We would still need evidence from that particular call before naming the failure.
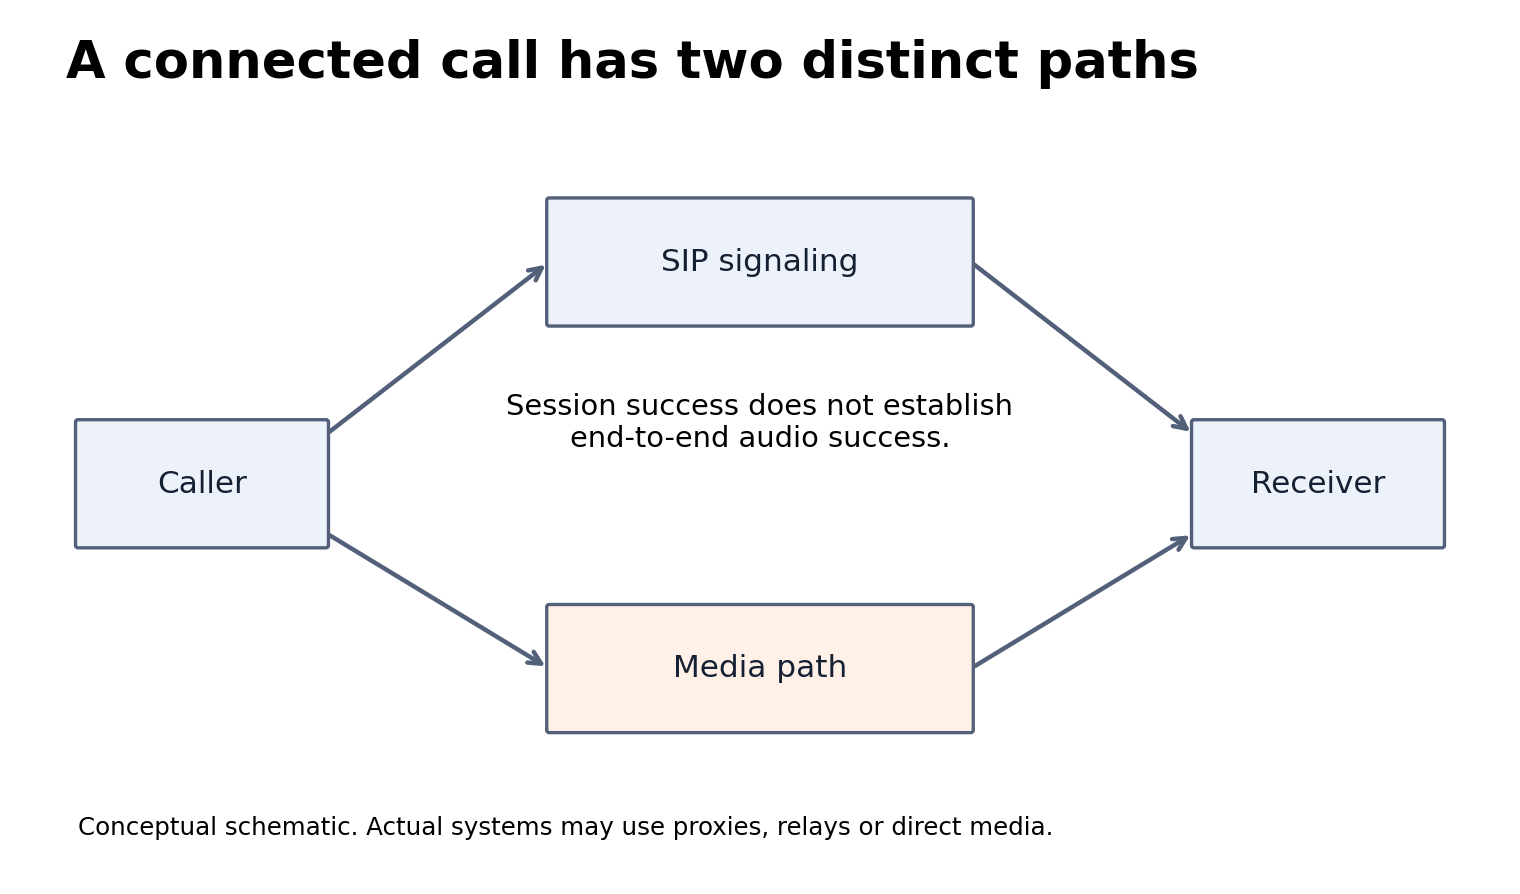
Figure 1. A conceptual separation of responsibilities. Actual systems may use proxies, media relays, or direct media. This is not a diagram of a particular deployment.
The diagram deliberately does not claim that every call follows exactly this arrangement. Its purpose is to separate session control from media delivery. A connected indicator reports something about the session; audible speech requires additional operations to succeed. The first statement may be true while the second remains unproven. That is a small distinction with large consequences for troubleshooting. A useful diagram should expose such a distinction and state its limits, rather than imply that a simplified picture contains the entire system.
For this example, I would want observations at three places. Is audio being produced after capture? Are media packets visible at the sending boundary? At the receiving boundary, do packets arrive and become audio output? These are investigative questions, not instructions for a particular platform. Each observation needs a timestamp, a location, and a way to associate it with the same call. Combining a log from yesterday with a capture from today can produce a convincing explanation of an incident that never existed.
Suppose packets are visible on the sending side. That does not establish that the other person heard speech. Something could still differ along the route, at the receiver, or in the output selection. Conversely, an empty capture does not immediately condemn the microphone. Was the correct interface observed? Did collection start in time? These are competing possibilities, not a diagnosis. The observation mechanism belongs inside the investigation. Sometimes the first thing to establish is whether we are looking at the right evidence at all.
Different carriers, different mechanisms
Sound and radio should not be merged into one physical process. OpenStax's discussion of sound describes pressure waves and the role of their amplitude.[5] NASA places radio waves and visible light within the electromagnetic spectrum.[6] A conversation can involve several physical representations along its path, but that does not make them interchangeable. When someone says “signal,” a productive first question is: what changes here? Air pressure, circuit voltage, light intensity, a sequence of symbols, or the state described by a protocol message?
A letter offers a useful analogy. Paper, writing, the address on the envelope, and the delivery procedure perform different jobs. An envelope arriving does not make the enclosed statement true. A readable address does not prove that the recipient read the letter. The analogy helps separate responsibilities, but it does not explain an electrical circuit or a biological mechanism. That limit matters. A familiar story can introduce an unfamiliar system; it cannot replace the evidence required to explain how that system actually operates.
This is also how I want to approach biological and social signaling later in the series. Calling a cell a server, or calling an organism a network, can suggest questions. It cannot establish the relevant mechanism. We will need the appropriate biological evidence rather than a borrowed engineering vocabulary. Likewise, observing a human response does not automatically tell us what information the person received or how they interpreted it. Shared words can connect investigations while concealing important differences if we stop checking what those words mean.
The series therefore has a common question rather than a single universal mechanism: how does a system register a change, use it, and respond when the information is incomplete or misleading? Electronic circuits, living systems, and human institutions can be examined through that question without assuming they follow identical rules. Finding a resemblance is easy. Identifying where the resemblance stops being useful requires more work. I want the examples to make unfamiliar subjects approachable while preserving the boundaries that keep an explanation honest.
Six invented readings and one wrong decision
Let us build an example small enough to audit completely. Imagine a door sensor whose output is usually 0.4 volts when open and 2.8 volts when closed. These values are invented for the explanation. They are not specifications or measurements from a real device. We assume higher voltage indicates a closed door. A simple decision rule declares “closed” above 1.6 volts and “open” otherwise. Now we can ask a precise question: what happens when a reading falls on the wrong side of that threshold?
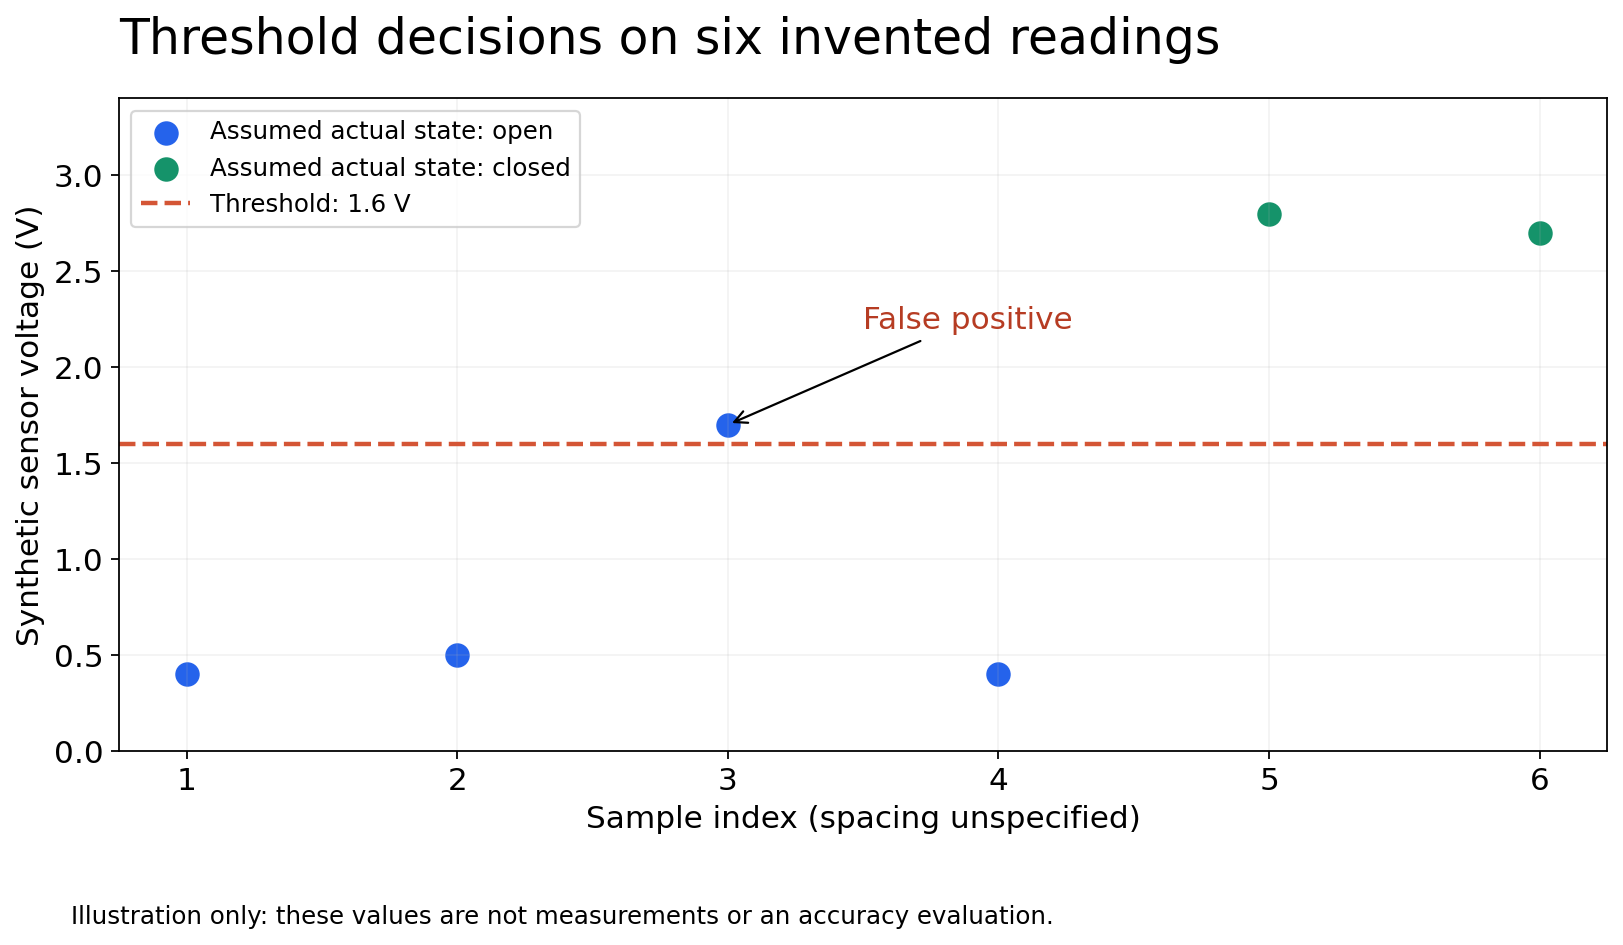
Figure 2. Invented readings, not field measurements. Sample spacing is unspecified. Blue points represent an assumed open door; green points represent an assumed closed door. The dashed line is the decision threshold.
Take the readings 0.4, 0.5, 1.7, 0.4, 2.8, and 2.7 volts. Assume the door was actually open for the first four observations and closed for the final two. Our rule declares the third observation closed, making it a false positive in this example. We can identify the mistake because we stipulated the actual state independently. Without that reference, the voltage would be only an observation. We could label it, but we could not demonstrate that the label matched the door's condition.
Raising the threshold to 2.0 volts correctly separates these six points. That is an improvement on this tiny constructed dataset, but it proves little about a real installation. We chose the numbers and then adjusted the rule after seeing them. Nothing here tells us about an unfamiliar operating condition, a partially open door, or a different distribution of readings. A separate evaluation would be necessary. A decision boundary that fits the data used to choose it is not automatically evidence of reliable performance elsewhere.
We could instead require three consecutive readings above the threshold before declaring the door closed. That rule might ignore an isolated spike, but it adds delay. If observations occur every 100 milliseconds, the interval from the first qualifying reading to the third is 200 milliseconds. The total wait after the physical event also depends on when it happened relative to sampling. This arithmetic is not a recommendation for a real product. It demonstrates that reducing one type of error can introduce a different cost.
Whether the trade-off is acceptable depends on the job. A delay that is harmless for one indicator may be unacceptable for another application. Calling a threshold “good” therefore leaves important questions unanswered: under which conditions, within what time limit, and at what cost when wrong? The numbers describe a rule, not its suitability for every use. Engineering judgment begins when the requirements enter the discussion. Without them, optimizing a metric can produce a system that performs well on paper and poorly for the person relying on it.
Noise depends partly on the question
For this discussion, noise is whatever interferes with distinguishing the information we are trying to recover. That practical description is not a complete treatment of every noise process. In a recording, another person's speech might be something you want removed. In a different investigation, that same speech might be the evidence of interest. Its relevance changes with the task. This does not mean every unwanted variation contains a hidden message. Establishing an origin or an interpretation still requires evidence beyond finding the variation interesting.
Return to the hypothetical call. A strange sound might be irritating to the caller but useful to someone investigating the failure. Its onset, duration, and relationship to other observations could help narrow possibilities. I am not proposing that one recognizable sound proves one particular cause. The point is to connect a pattern with independent evidence and test alternatives. A symptom can be informative without being uniquely diagnostic. Treating a memorable symptom as a complete explanation is attractive because it makes the story shorter, not because it necessarily makes it better.
Larger readings are not automatically more informative either. Multiply every voltage in our invented sensor dataset, and the threshold, by ten. The classification problem stays the same: the same points belong to the assumed states, and the same third observation is wrongly classified. We changed the scale, not the separation. Real amplification introduces additional physical questions, which this arithmetic does not address. The example makes only a limited point: a larger displayed number does not by itself establish a better decision. A dashboard's dramatic spike needs context too.
Evidence needs a time, place, and method
Before building a story around a measurement, I want four basic details: what was measured, where, when, and how. Without them, a number can look precise while remaining difficult to interpret. In a real version of the door experiment, “voltage” would require a defined measurement point and reference. In the call investigation, the capture location matters. These details are not bureaucratic decoration. They determine whether two observations can be compared and whether either one supports the claim we want to make.
Now consider an empty graph. It could tempt us to conclude that nothing happened. But missing observations and absent events are different propositions. A hypothetical sensor might have lost power; collection might have stopped; a display filter might exclude the relevant interval. These are possibilities, not a diagnosis of a particular dashboard. The graph alone cannot select among them. Before interpreting silence as a property of the world, we need evidence that the observation process was capable of reporting the event in question.
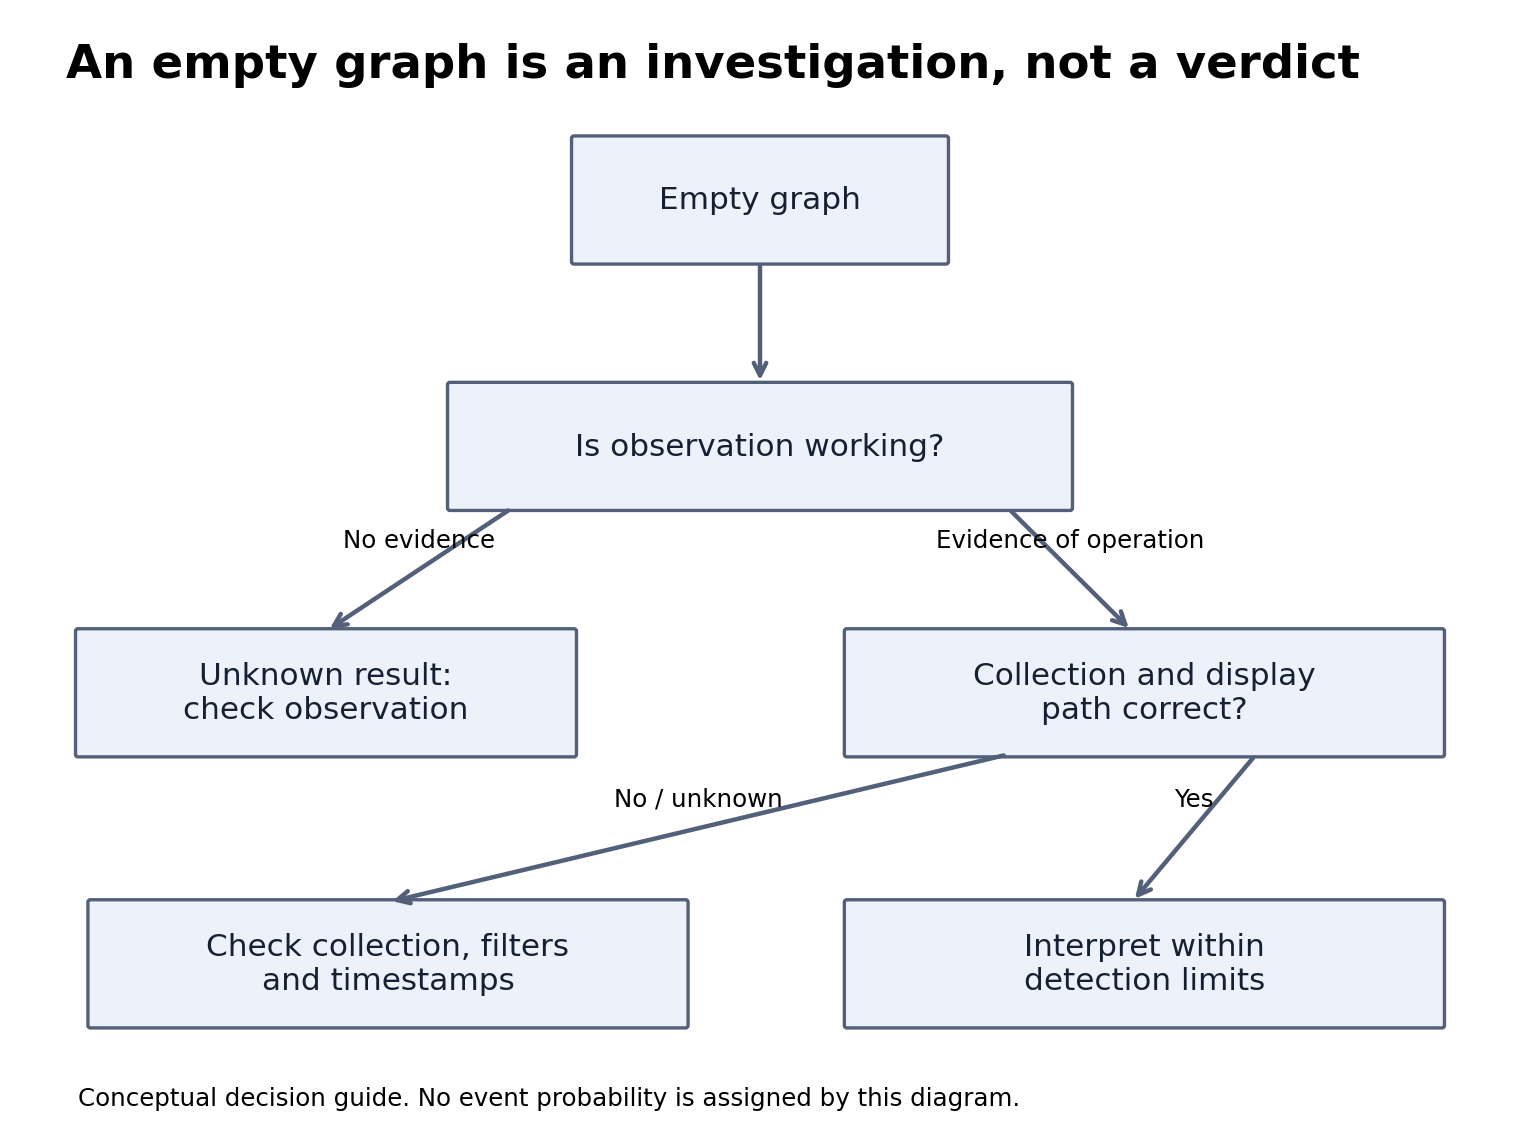
Figure 3. An investigation guide, not a probability model. A working observation path still has detection limits. The diagram does not establish that an event was absent.
Each branch in this diagram asks for evidence. It assigns no probabilities to the alternatives. A real investigation would need records that help eliminate possibilities, such as collection timestamps or evidence that the observation system remained operational. A tidy diagram can otherwise create the illusion that the explanation is already established. Sometimes it is only a map of work still to do. Its job is to organize evidence, not manufacture it. Readers should be able to tell which nodes describe observations and which represent untested possibilities.
How far can the claim travel?
Suppose a sensor trace changes when someone enters a room. At first, we can say that both events occurred around the same time. Establishing that the person's presence caused the change requires testing alternatives. Did opening the door change something else? Did equipment move? These questions are illustrative rather than a complete inventory for any particular sensing technology. The lesson is narrower: coincident events can start an investigation, but they do not finish one. A compelling headline should not erase that distance between observation and explanation.
A useful technique is to make the first claim smaller. Instead of declaring that a system “detects people,” ask whether it distinguished a defined change under specified conditions in this experiment. Then test what happens outside those conditions. A smaller claim may sound less impressive, but it is easier to examine and can provide a firmer basis for later work. I want these articles to leave readers with questions they can apply to their own observations, rather than just a feeling that invisible systems are astonishing.
Accuracy needs the same care. Our sensor rule got five of six invented observations right, but the mixture of states was chosen by us. A different mixture can change the apparent success of a simple rule. If a door is usually closed, always declaring it closed might look deceptively good in an aggregate count. We therefore need to distinguish the kinds of mistakes, not merely total them. The frequency of each state and the consequences of each error are part of interpreting performance, not optional details added afterward.
The goal is not permanent suspicion. If a rule works on independent observations under clearly stated conditions, that adds evidence in its favor. It does not magically establish performance in conditions never examined. Confidence should grow with the evidence and remain bounded by it. Jumping from a tiny demonstration to a sweeping claim is a mistake; refusing to accept any result regardless of evidence is another. An investigation needs a way to revise belief in both directions rather than an argument designed to survive every possible observation.
Try this exercise with the silent-call example. Write three possible explanations, then describe an observation that would make each explanation less plausible. If you suspect the receiving speaker, what would change your mind? If you suspect the network path, what evidence would conflict with that view? You do not need the answer immediately. The exercise separates testing an explanation from collecting details that decorate it. That difference is central to investigative writing, especially when the writer begins with an appealing systems analogy.
Sources deserve equivalent scrutiny. Finding a paper does not mean it supports the sentence placed next to its link. We need to inspect the question it asked, the evidence it used, and the limits of its conclusion. An established mechanism may not require the newest news story; a changing protocol or emerging claim may require current documentation. References should help readers trace the reasoning. They should also make it clear when an example is an original construction rather than a reported experiment or an account of personal experience.
A way to keep looking
This series will examine signaling and media paths in telephony, voltage and timing in embedded systems, propagation in radio, and representations of sound and light. Biological mechanisms and astronomical observations need their own evidence rather than borrowed certainty. The value of a long series is room for distinct questions. Its responsibility is to avoid repeating the same explanation under different titles. Each article should contribute a mechanism, a worked example, a carefully bounded comparison, or an investigation that changes what the reader can notice and evaluate.
You can use the opening question immediately. When a device or dashboard reports a state, ask which observation produced that report. Then ask what the report does not yet establish. A call timer does not establish audible speech; a sensor value needs an interpretation rule; an empty graph needs an operational observation path. The aim is calibrated trust. Signals become useful when we connect them to mechanisms and evidence, while remembering that the world contains changes that were never deliberately addressed to us as messages.
Series: Signals Around Us — the 300-article research roadmap. This is article 1. Planned titles are not published articles.
References
- Alan V. Oppenheim, Signals and Systems, MIT OpenCourseWare, Spring 2011. Time-domain and frequency-domain representations.
- C. E. Shannon, A Mathematical Theory of Communication, Bell System Technical Journal 27 (1948), pp. 379–423 and 623–656; corrected reprint, introduction and communication-system diagram. The article paraphrases the limited engineering distinction rather than extending it into a theory of meaning.
- J. Rosenberg et al., RFC 3261: SIP, June 2002, abstract and introduction. Foundational protocol description, not a complete current implementation guide.
- H. Schulzrinne et al., RFC 3550: RTP, July 2003, abstract. The RFC has subsequent updates; this article uses its basic distinction between real-time transport and a quality-of-service guarantee.
- OpenStax, Physics, 14.2: Sound Intensity and Sound Level. Pressure waves and amplitude.
- NASA, Introduction to the Electromagnetic Spectrum. Radio waves and visible light within the electromagnetic spectrum.
The call incident and sensor dataset are explicitly constructed examples. They are not field measurements, product specifications, or claims about a particular deployment. Diagrams were created for this article.